
THE CHALLENGE
Once the team understands the need of their stakeholders, they must locate, curate, and present data in an easy-to-understand manner. Information for enterprise reporting is often sourced from disparate systems and then organized to paint a complete picture. The Analytics team regularly identifies data sources, builds out data pipelines where none exist, and creates combined data outputs to use in reporting. Once the data is available, it is often complex and not easily understood. The team creates dashboards to convert this raw information into actionable intelligence.
THE OUTCOME
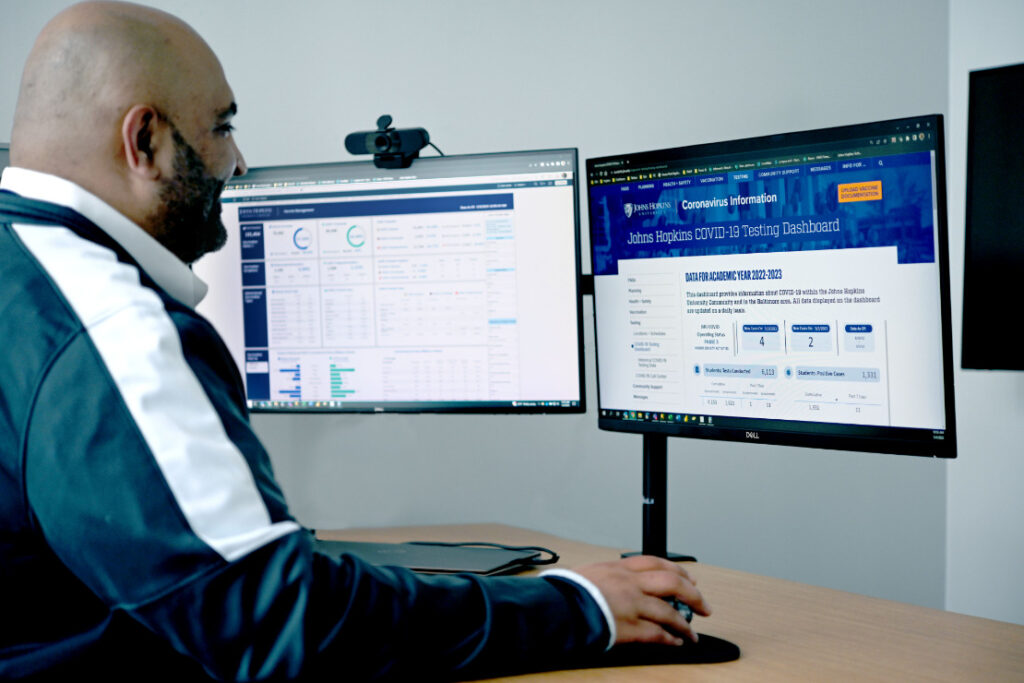
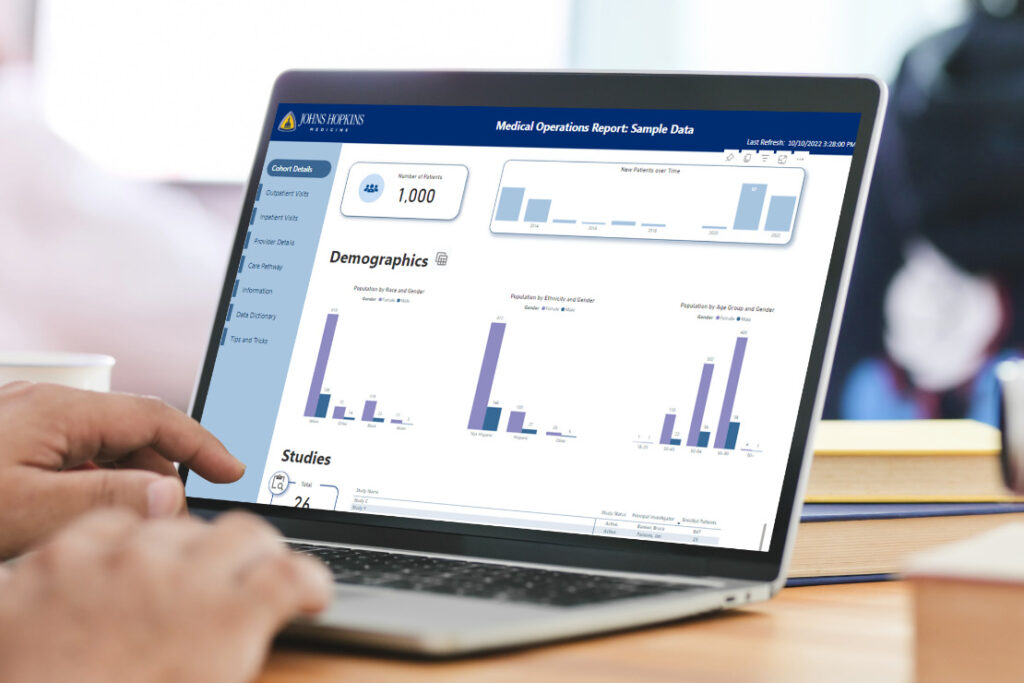
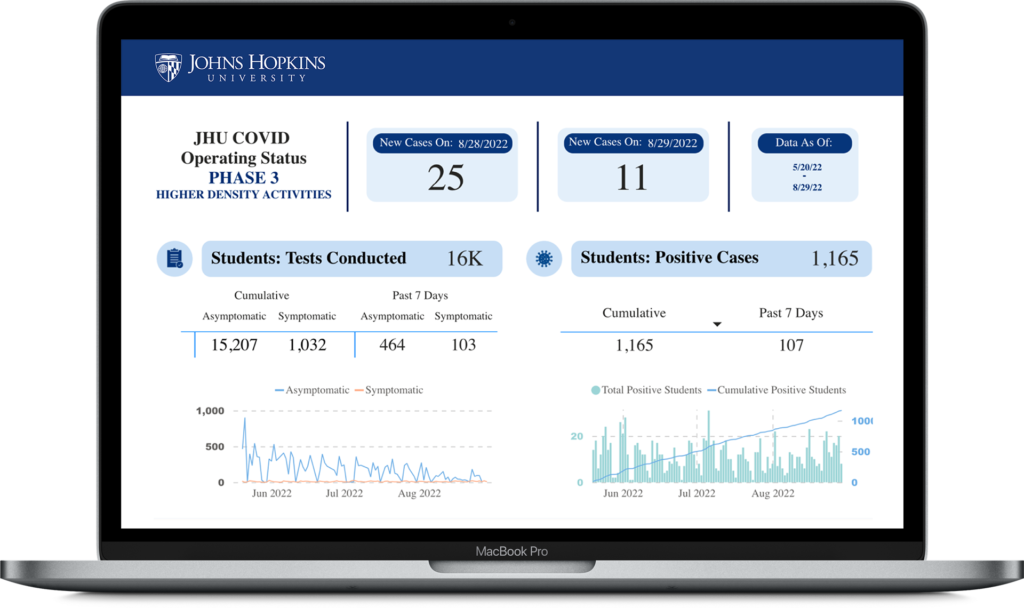
The TIC Analytics team now builds dashboards for the enterprise to help Johns Hopkins leadership, faculty, and staff more easily visualize key data. Examples of TIC-built dashboards include the following: The public-facing COVID dashboard helped administrators during COVID outbreaks in early 2022. The Employee Health dashboard allows Occupational Health Services to track daily test results with a goal of keeping Johns Hopkins people and patients safe. The Precision Medicine Centers of Excellence (PMCOE) operational research dashboards standardize reporting, use projection data, and allow leadership to make decisions by measuring and tracking the growth and success of cohorts.